| Nombre |
Porcentaje |
| Parcial |
Total |
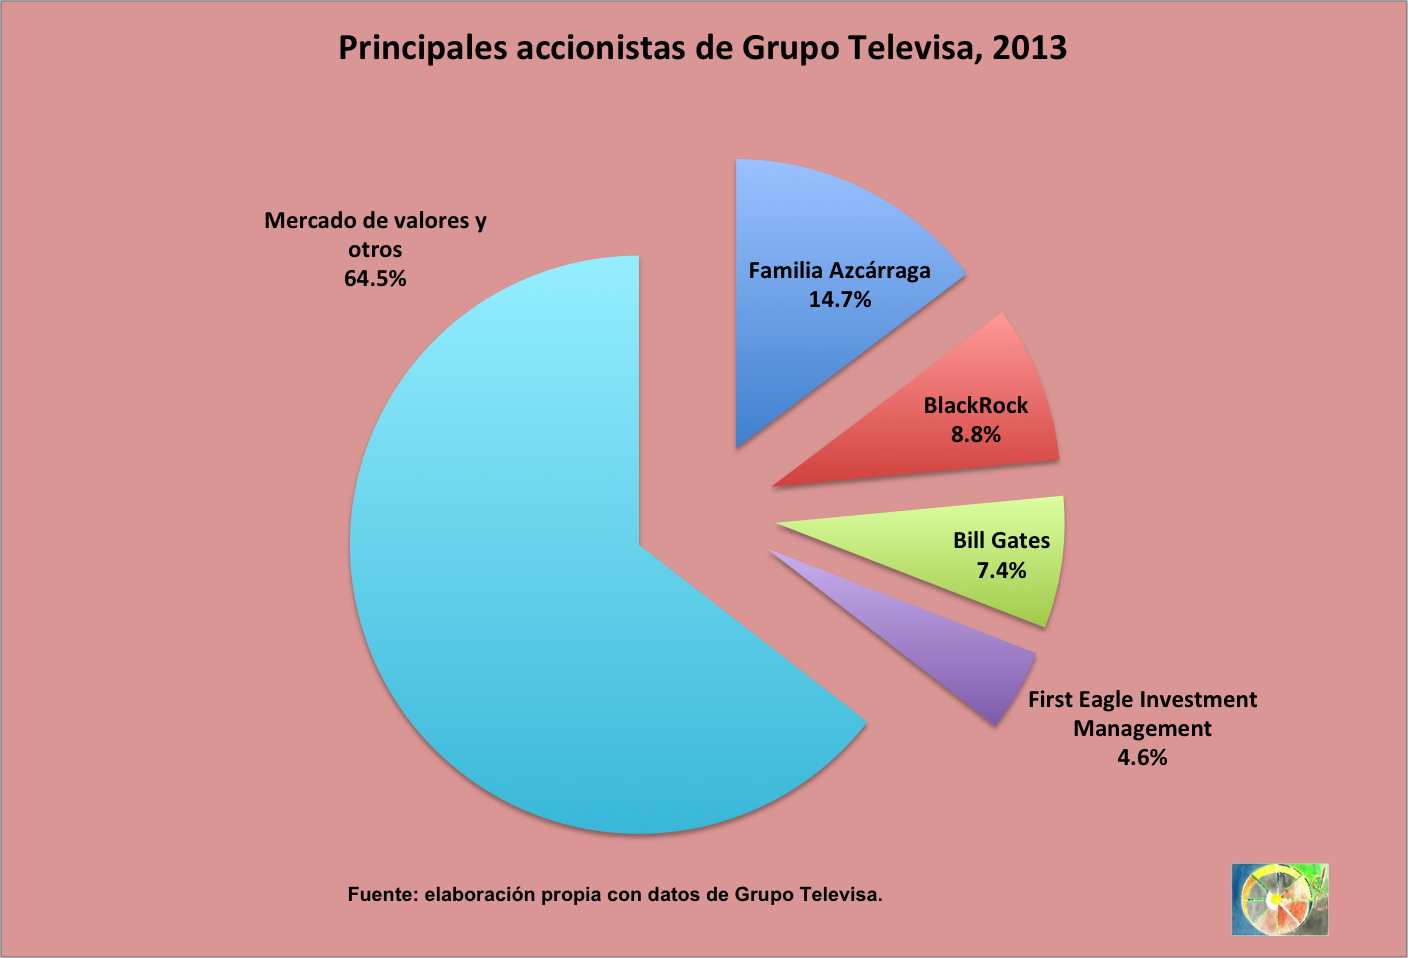
| Familia Azcárraga |
|
14.700% |
| Tenencia propia por medio de: |
|
|
| Fideicomiso Azcárraga 1/ |
14.700% |
|
| Familia Gates |
|
7.431% |
| Tenencia propia por medio de: |
|
|
| Bill & Melinda Gates Foundation 2/ |
2.724% |
|
| Cascade Investment 3/ |
4.706% |
|
| Inversionistas institucionales y fondos extranjeros |
| Dodge & Cox |
|
8.664% |
| Tenencia propia por medio de: |
|
|
| Dodge & Cox 1/ |
4.336% |
|
| A través de los fondos: |
|
|
| Dodge & Cox International Stock 2/ |
4.177% |
|
| Dodge & Cox Global Stock 1/ |
0.151% |
|
| OppenheimerFunds |
|
6.180% |
| Tenencia propia por medio de: |
|
|
| OppenheimerFunds, Inc. 2/ |
3.49% |
|
| A través de los fondos: 1/ |
|
|
| Oppenheimer Developing Markets A |
1.621% |
|
| Oppenheimer Global A |
0.700% |
|
| Oppenheimer Global Securities VA IV |
0.206% |
|
| Oppenheimer International Growth A |
0.164% |
|
| Lazard Asset Management LLC |
|
4.888% |
| Tenencia propia por medio de: |
|
|
| Lazard Asset Management LLC 1/ |
2.645% |
|
| Lazard Asset Management Ltd. 4/ |
1.151% |
|
| A través de los fondos: |
|
|
| Lazard Emerging Markets Equity Instl. 1/ |
1.092% |
|
| First Eagle Investment Management |
|
3.718% |
| A través de los fondos: |
|
|
| First Eagle Global A 5/ |
2.428% |
|
| First Eagle Overseas A 6/ |
1.289% |
|
| Invesco |
|
2.315% |
| Tenencia propia por medio de: |
|
|
| Invesco Advisers, Inc. 2/ |
1.292% |
|
| A través de los fondos: |
|
|
| Invesco Developing Markets A 2/ |
0.381% |
|
| AIM Private Asset Mgt Intl ADR Gr 1/ |
0.325% |
|
| Invesco International Growth A 2/ |
0.317% |
|
| Comgest Group |
|
1.950% |
| Tenencia propia por medio de: |
|
|
| Comgest SA 5/ |
1.188% |
|
| Comgest Asset Management International L 1/ |
0.763% |
|
| UBM Financial Corporation 1/ |
|
1.933% |
| Tenencia propia por medio de: |
|
|
| Scout Investment Advisors Inc |
0.664% |
|
| Scout Investments, Inc. |
0.635% |
|
| A través de los fondos: |
|
|
| Scout International |
0.635% |
|
| Wells Fargo and Company |
|
1.587% |
| Tenencia propia por medio de: |
|
|
| Wells Capital Management Inc. 2/ |
1.080% |
|
| A través de los fondos: |
|
|
| Wells Fargo Advantage Emerg Mkts. Eq. A 1/ |
0.508% |
|
| Commonwealth Bank of Australia |
|
1.425% |
| Tenencia propia por medio de: |
|
|
| Colonial First State Global Asset Mgmt. 2/ |
1.425% |
|
| Davis Advisors |
|
1.268% |
| Tenencia propia por medio de: |
|
|
| Davis Selected Advisers 2/ |
0.984% |
|
| A través de los fondos: |
|
|
| Davis NY Venture A 6/ |
0.284% |
|
| BlackRock Inc. |
|
1.242% |
| Tenencia propia por medio de: |
|
|
| BlackRock Investment Management (UK) Ltd. 2/ |
1.242% |
|
| Fidelity Investments |
|
1.239% |
| Tenencia propia por medio de: |
|
|
| Management and Research Company 2/ |
0.843% |
|
| A través de los fondos: |
|
|
| Fidelity Series Emerging Markets 1/ |
0.396% |
|
| Westwood Global Investments LLC |
|
1.222% |
| Tenencia propia por medio de: |
|
|
| Westwood Global Investments LLC 1/ |
1.222% |
|
| Macquarie Group |
|
1.212% |
| Tenencia propia por medio de: |
|
|
| Delaware Management Business Trust 2/ |
0.875% |
|
| A través de los fondos: |
|
|
| Delaware Emerging Markets A 1/ |
0.337% |
|
| Natixis Global Asset Management, L.P. |
|
0.968% |
| Tenencia propia por medio de: |
|
|
| Harris Associates L.P. 2/ |
0.697% |
|
| A través de los fondos: |
|
|
| Oakmark International I 1/ |
0.272% |
|
| Credit Agricole |
|
0.637% |
| Tenencia propia por medio de: |
|
|
| Credit Agricole Asset Management Group 2/ |
0.637% |
|
| Findlay Park Partners |
|
0.579% |
| Tenencia propia por medio de: |
|
|
| Findlay Park Partners LLP 1/ |
0.579% |
|
| Northern Trust Corporation |
|
0.193% |
| A través de los fondos: |
|
|
| Northern Multi-Manager Emerging Market Eq. 1/ |
0.193% |
|
| Dimensional Investment Group |
|
0.151% |
| A través de los fondos: |
|
|
| DFA Emerging Markets Core Equity I 5/ |
0.151% |
|
| Fondos de inversión mexicanos 1/ |
| Impulsora de Fondos Banamex |
|
0.970% |
| A través de los fondos: |
|
|
| FONBNM.B3-A |
0.461% |
|
| BNMPAT.B2-A |
0.360% |
|
| BNMPAT+.B0-E |
0.120% |
|
| BNMIPC+.B0-E |
0.029% |
|
| Actinver |
|
0.192% |
| A través de los fondos: |
|
|
| ACTIVAR.B |
0.083% |
|
| ACTICRE.B |
0.074% |
|
| MAYA.B1 |
0.014% |
|
| ACTIPAT.B |
0.013% |
|
| ACTOTAL.B |
0.008% |
|
| Scotia Fondos |
|
0.154% |
| A través de los fondos: |
|
|
| SCOTIPC.L |
0.109% |
|
| SCOT-RV.L |
0.045% |
|
| Operadora de Fondos Banorte |
|
0.189% |
| A través de los fondos: |
|
|
| NTE+SEL.B |
0.136% |
|
| NTE+DE.F1 |
0.031% |
|
| NTE+IN.F1 |
0.016% |
|
| NTE+EMP.F1 |
0.005% |
|
| Ixe Fondos |
|
0.096% |
| A través de los fondos: |
|
|
| IXECON.BFM1 |
0.078% |
|
| IXEESP.BI |
0.019% |
|
| BBVA Bancomer Gestión |
|
0.091% |
| A través de los fondos: |
|
|
| B+RV.E |
0.039% |
|
| BMERPAT.B |
0.032% |
|
| SBMIX.B |
0.019% |
|
| Operadora GBM |
|
0.084% |
| A través de los fondos: |
|
|
| GBMCRE.BO |
0.033% |
|
| GBMAAA.BO |
0.026% |
|
| GBMMOD.BO |
0.017% |
|
| GBMIPC.BO |
0.006% |
|
| GBMLATM.B |
0.003% |
|
| Gestión Santander México |
|
0.067% |
| A través de los fondos: |
|
|
| ST&ER-I.B1 |
0.016% |
|
| ST&ER-E.B |
0.015% |
|
| STER-RV.B1 |
0.014% |
|
| STER-GR.B |
0.010% |
|
| SVIVE20.B |
0.007% |
|
| ST&ERBM.B0 |
0.006% |
|
| SURA (ING Investment Management) |
|
0.060% |
| A través de los fondos: |
|
|
| ING-PAT.B1 |
0.041% |
|
| ING-IPC.B3 |
0.019% |
|
| HSBC Operadora de Fondos |
|
0.038% |
| A través de los fondos: |
|
|
| HSBCBOL.B-1 |
0.031% |
|
| HSBC-RV.B-1 |
0.008% |
|
| Operadora Inbursa |
|
0.037% |
| A través de los fondos: |
|
|
| FONIBUR.B |
0.020% |
|
| IBUPLUS.B |
0.012% |
|
| INBURSA.B-3 |
0.005% |
|
| Fondos de Inversión Interacciones |
|
0.031% |
| A través de los fondos: |
|
|
| INTERDV.B |
0.015% |
|
| INTEC.B |
0.011% |
|
| INTEPOL.B |
0.005% |
|
| ISOLIDO.B |
0.000% |
|
| Vector Fondos |
|
0.027% |
| A través de los fondos: |
|
|
| VECTPA.F |
0.016% |
|
| VECTCR.F |
0.012% |
|
| Operadora de Fondos Nafinsa |
|
0.013% |
| A través de los fondos: |
|
|
| NAFINDX.F1 |
0.013% |
|
| Principal Fondos de Inversión |
|
0.012% |
| A través de los fondos: |
|
|
| PRINRVA.FF |
0.012% |
|
| Compass Investments de México |
|
0.009% |
| A través de los fondos: |
|
|
| CRECE+.B-1 |
0.005% |
|
| I+BOLSA.B-1 |
0.004% |
|
| Fondos de Inversión Multiva |
|
0.006% |
| A través de los fondos: |
|
|
| MULTIPC.B |
0.006% |
|
| Monex Operadora de Fondos |
|
0.004% |
| A través de los fondos: |
|
|
| MONEXCR.BFC-1 |
0.004% |
|
| Operadora Mifel |
|
0.002% |
| A través de los fondos: |
|
|
| MIFIPC.B |
0.002% |
|
| Invex Operadora |
|
0.001% |
| A través de los fondos: |
|
|
| INVEXMX.BMF |
0.001% |
|
| Operadora Finamex |
|
0.000% |
| A través de los fondos: |
|
|
| F-INDIC.B |
0.000% |
|
|
|
|
| Mercado de valores |
|
39.299% |
|
|
|
| Totales |
|
100.000% |
1/ Al 31 de marzo de 2012.
2/ Al 31 de diciembre de 2011.
3/ Al 19 de marzo de 2010.
4/ Al 30 de abril de 2012.
5/ Al 29 de febrero de 2012.
6/ Al 31 de enero de 2012.
Fuentes: elaboración propia con base en información de:
|